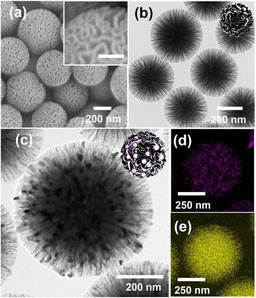
Figure 26.

a) SEM and b) TEM images of WSNs. The inset scale bar is 100 nm. c) HRTEM image of WSN‐CoO. Bottom‐right panel) Energy‐dispersive X‐ray spectroscopy (EDS) elemental mapping of WSN‐CoO showing d) cobalt and e) silicon. Reprinted with permission from Ref. 50. Copyright 2016 Korean Chemical Society and Wiley‐VCH.
