Figure 60.

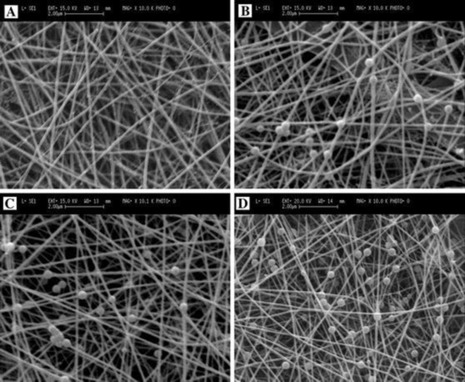
SEM images of DFNS/nylon‐6 composite nanofibers with varying DFNS concentrations: a) 0, b) 20, c) 33, and d) 50 % w/w. The scale bars are 2.00 μm Reprinted with permission from Ref. 89. Copyright 2015 Springer.

SEM images of DFNS/nylon‐6 composite nanofibers with varying DFNS concentrations: a) 0, b) 20, c) 33, and d) 50 % w/w. The scale bars are 2.00 μm Reprinted with permission from Ref. 89. Copyright 2015 Springer.