
Figure 7.
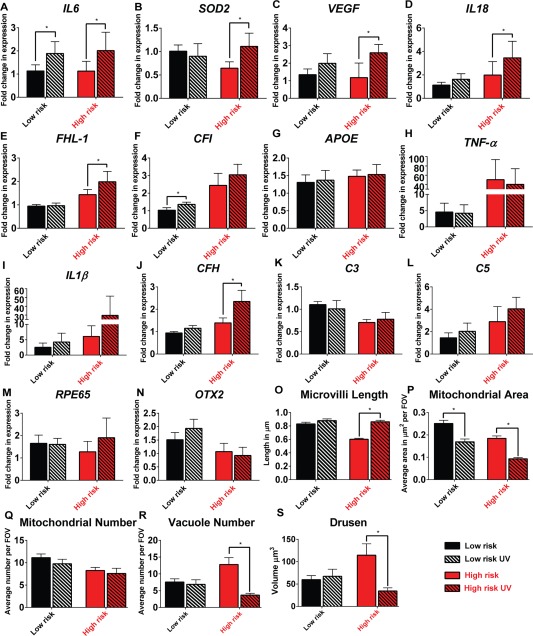
The response of low‐ and high‐risk retinal pigment epithelium (RPE) to intermittent UV exposure. (A–N): Quantitative reverse transcriptase polymerase chain reaction expression data shown as fold change in relation to low‐risk control; data are presented as mean ± SEM, n = 3, *, p < .05. [Correction made here after initial online publication.] (O): Average length of microvilli per field of view (100 µm2), UV exposure increased microvilli length in high‐risk induced pluripotent stem cell (iPSC)‐RPE cells, p < .0001. (P): Average mitochondrial area per field of view (100 µm2), UV exposure decreased mitochondrial area in both low‐ and high‐risk iPSC‐RPE (p = .0003 and p = .0002). (Q): Average mitochondrial number per field of view (100 µm2), UV exposure did not influence the average number of mitochondria (p = .9789). (R): Average vacuole number (calculated per field of view: 100 µm2), UV exposure decreased the number of vacuoles in high‐risk cells, p = .0038. (S): Drüsen area, UV exposure decreased the deposition of C5b‐9 and apolipoprotein E in high‐risk iPSC‐RPE cells, *, p = .0002. Abbreviations: APOE, apolipoprotein E; CFI, complement factor I; FHL‐1, factor H‐like protein 1; FOV, field of view; IL, interleukin; OTX, orthodenticle homeobox 2; RPE, retinal pigment epithelium; SOD, superoxide dismutase; TNF, tumor necrosis factor; VEGF, vascular endothelial growth factor.