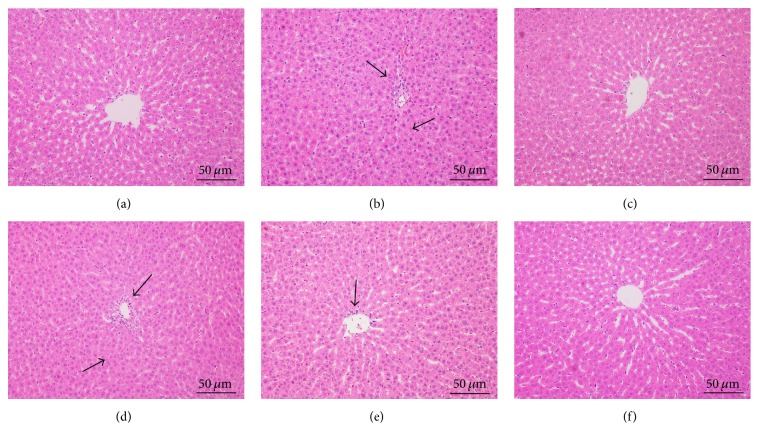
Figure 3.
Effect of PD treatment on liver histological changes by H&E staining (200x). Representative histopathological alterations of liver are displayed of different groups. (a) Normal control group; (b) Ethanol model group; (c) Ethanol + Silymarin 100 mg/kg; (d) Ethanol + PD 25 mg/kg; (e) Ethanol + PD 50 mg/kg; (f) Ethanol + PD 100 mg/kg. Arrows indicated both apparent focal necrosis and inflammatory infiltration. Obviously normal morphology and great improvement in hepatocyte structure with silymarin and high-dose PD, similar to that of NC group.

