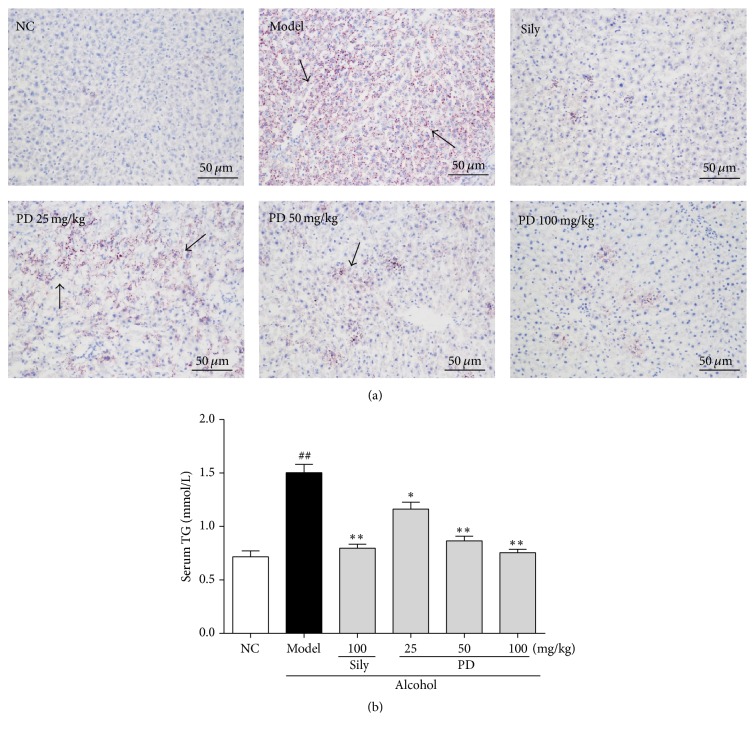
Figure 4.
Effect of PD on hepatic lipid accumulation in liver tissues. Representative of (a) Oil Red O-stained photos from each group and (b) TG level are presented. NC: normal control group; Model: ethanol model group; Sily: Ethanol + Silymarin 100 mg/kg; PD 25 mg/kg: Ethanol + PD 25 mg/kg; PD 50 mg/kg: Ethanol + PD 50 mg/kg; PD 100 mg/kg: Ethanol + PD 100 mg/kg. Arrows indicated appearance of prominent microvesicular steatosis. Values were presented as the mean ± SD. ##p < 0.01 versus NC group; ∗p < 0.05, ∗∗p < 0.01 versus model group.

