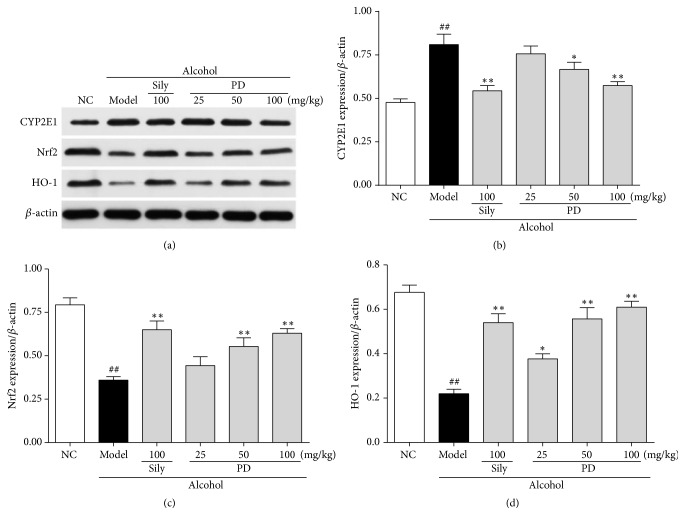
Figure 7.
Effect of PD on ethanol-induced oxidative stress. (a) Western blot analysis of CYP2E1, Nrf2, and HO-1 proteins. (b) Quantitative analysis of CYP2E1/β-actin ratio. (c) Quantitative analysis of Nrf2/β-actin ratio. (d) Quantitative analysis of HO-1/β-actin ratio. Values were presented as the mean ± SD. ##p < 0.01 versus NC group; ∗p < 0.05, ∗∗p < 0.01 versus model group.

