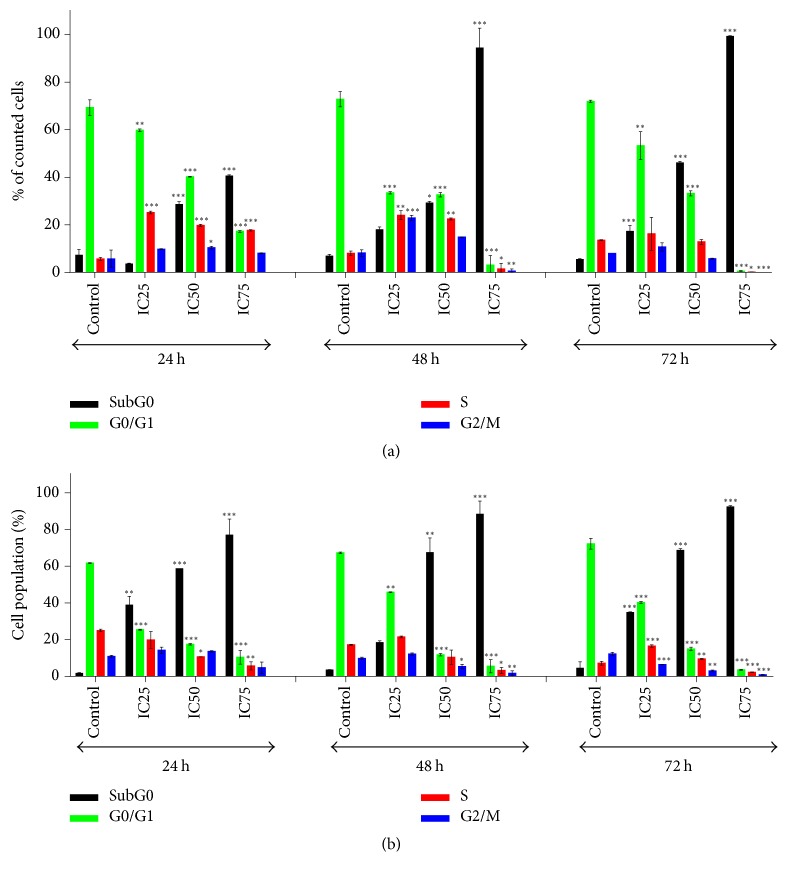
Figure 3.
Cell cycle analysis of MCF7 and MDA-MB-231 cancer cells treated with FAA at IC25, IC50, and IC75 values. The distribution of (a) MCF7 and (b) MDA-MB-231 cells undergoing apoptosis and in various phases of the cell cycle was determined for 24, 48, and 72 h in comparison to the respective controls. The values are presented as mean ± standard error of mean of three determinations, indicated by ∗, ∗∗, and ∗∗∗, showing a significant difference (p < 0.05, p < 0.01, and p < 0.001, resp.).

