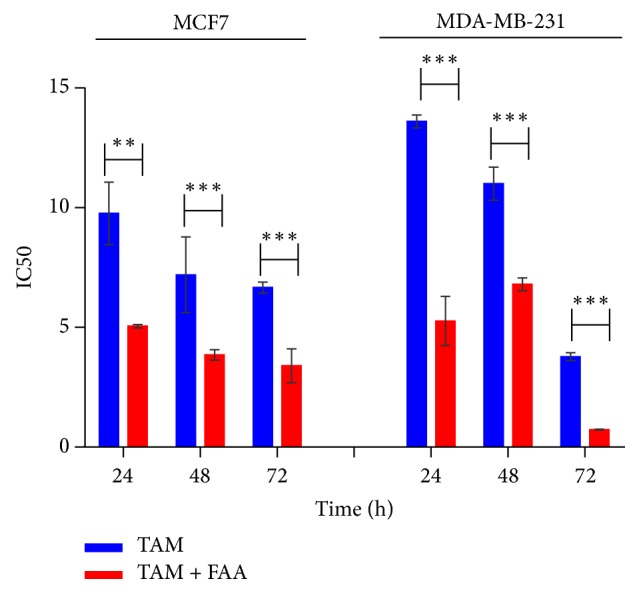
Figure 7.

Interaction between TAM and FAA in MCF7 and MDA-MB-231. Cells were treated with FA-TAM in a serial dilution for 24, 48, and 72 h. Values are calculated from three independent experiments. ∗p < 0.05, ∗∗p < 0.01, and ∗∗∗p < 0.001 comparing the combination of TAM-FAA with TAM alone.
