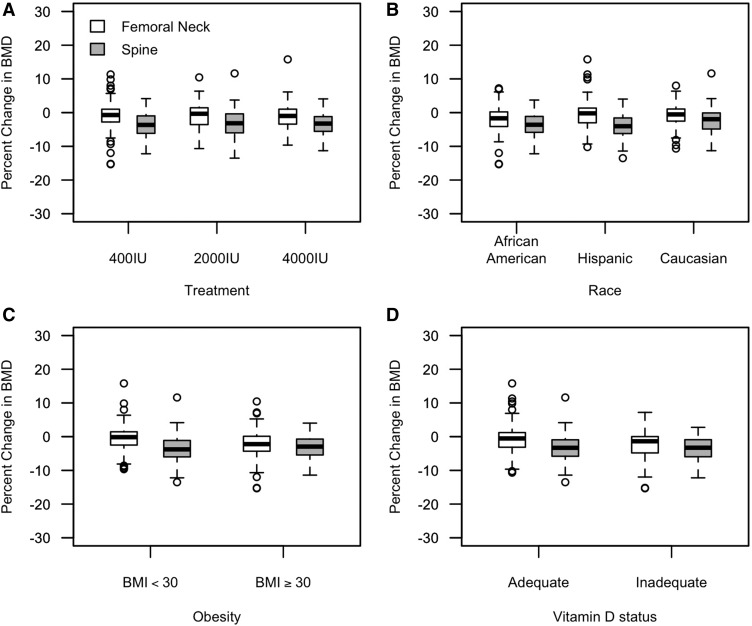
FIGURE 2.
Percentages of changes of BMD at 0–14 wk postpartum relative to BMD at 12–20 wk of gestation are shown by treatment, race, obesity status, and vitamin D status, respectively, for the cohort of 301 women. Circles represent outliers, and upper and lower bars represent ranges of data without including outliers. The upper, middle, and bottom of each box represent the 75%, 50%, and 25% quantiles of data, respectively. (A) Percentages of changes were not significantly different between treatment groups for the spine (P = 0.769) and femoral neck (P = 0.859). (B) Percentages of changes in spine BMD (P = 0.002) were significantly different in race/ethnicities, and percentages of changes in femoral neck BMD (P = 0.058) were trending. (C) Obesity tended to be associated with greater loss of spine BMD (P = 0.054) and was associated with femoral neck BMD (P < 0.001). (D) Vitamin D status was not associated with percentages of changes in spine BMD (P = 0.867) or femoral neck BMD (P = 0.104). BMI is expressed as kg/m2. BMD, bone mineral density.

