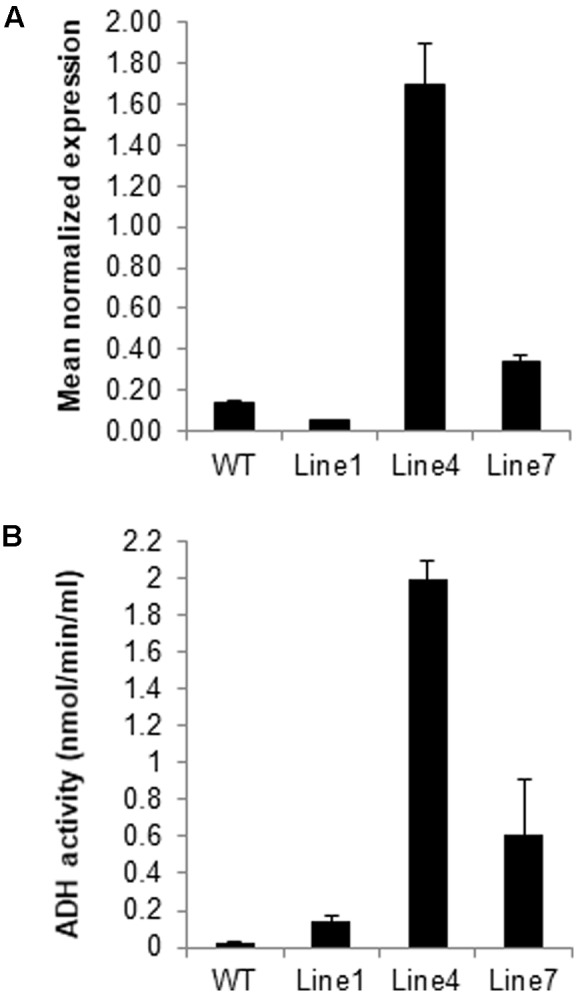
FIGURE 1.

Identification of sysr1-transgenic plants. (A) Results of the qRT-PCR analyses of sysr1 expression in three transgenic lines (Lines 1, 4, and 7) used for salt-tolerance assays. The sysr1 transcription level was expressed as relative mRNA abundance (2-ΔΔCt). Expression data were normalized against Nicotiana benthamiana EF1α transcript levels. For each sample, three biological replicates were analyzed with corresponding technical replicates. (B) Leaf ADH activity was compared among control and transgenic N. benthamiana plants. Control: WT plants. Lines 1, 4, and 7: homozygous transgenic lines (T3 generation).
