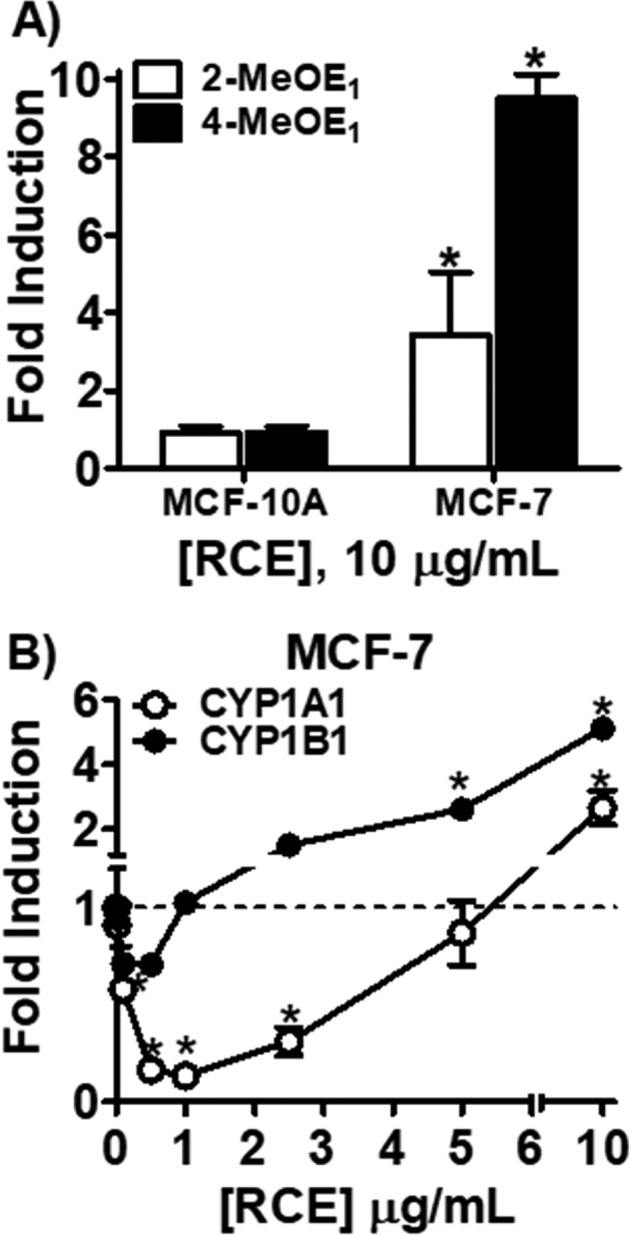
Figure 2.

LC-MS/MS analysis of methoxyestrone metabolites (2-MeOE1, 4-MeOE1) in MCF-10A and MCF-7 cells and CYP1A1 and CYP1B1 expression levels in MCF-7 cells. (A) MCF-10A and MCF-7 cells were treated with RCE (10 μg/mL) and for 48 h, washed with PBS, and then treated for 24 h with E2 (1 μM). (B) CYP1A1 and CYP1B1 expression levels were determined after 24 h treatment with RCE in MCF-7 cells by RT-qPCR analysis.
