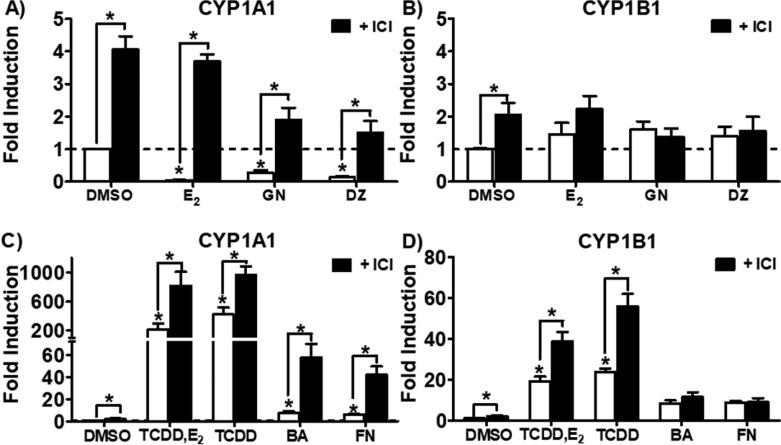
Figure 5.
CYP1A1 and CYP1B1 expression analyzed by RT-qPCR in MCF-7 cells after treatment with isoflavones. Cells were pretreated with ICI 182,780 (1 μM) for 2 h and ER agonists [E2 (1 nM), and GN and DZ (10 μM)] were added for an additional 24 h before RT-qPCR analysis of (A) CYP1A1 and (B) CYP1B1 levels. Treatments with AhR agonists [TCDD (10 nM), TCDD (10 nM) + E2 (1 nM), BA (10 μM) and FN (10 μM)] were added for an additional 24 h after 2 h ICI 182,780 pretreatment before RT-qPCR analysis of (C) CYP1A1 and (D) CYP1B1 levels.

