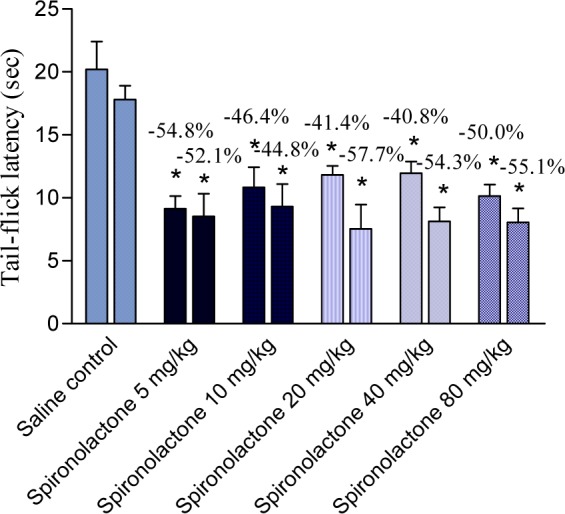
Figure 1. 1 h and 2 h values (first and second column, respectively) of tail flick latency (seconds) of saline (control) and spironolactone-treated mice. Each column represents mean ± SE of 6 mice/group.

*p<0.05 compared to saline group at the corresponding time
