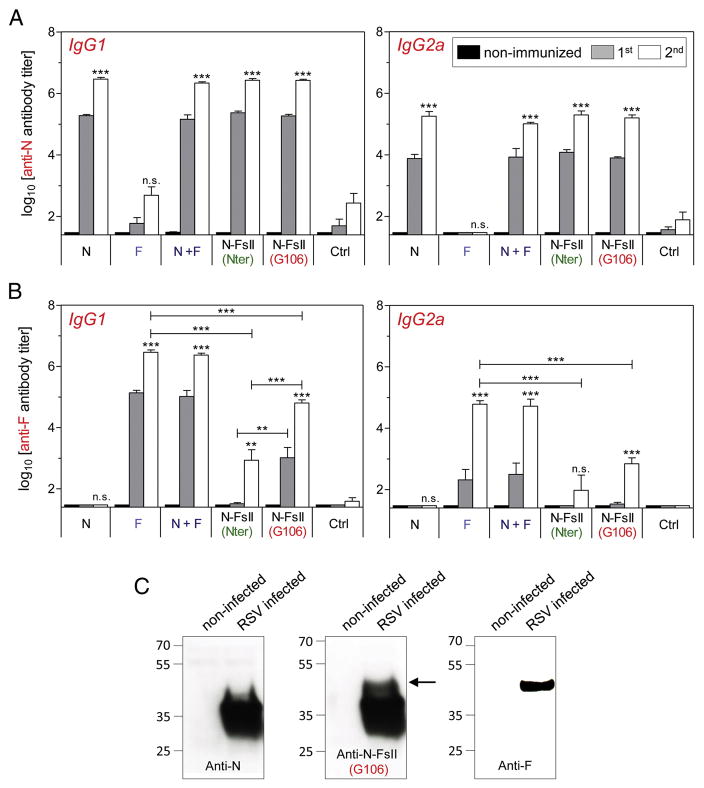
Figure 3. Measure of serum antibody responses.
BALB/c mice were immunized intranasally twice at two weeks interval with 2 μg of FsII-free N-nanorings (N) or postfusion F (F), 2 μg of N associated to 2 μg of F (N + F) or 2 μg of N-FsII (Nter or G106), adjuvanted with 5% Montanide™ Gel. As a control, mice received adjuvant alone (Ctrl). Sera were collected before (non-immunized) and two weeks after the prime (1st) or the boost (2nd) immunizations. N (A) and F (B) specific antibody titers were determined by ELISA. Data are mean + SEM of individual titers (n = 5–6). P values were determined according to the Student’s t test (**P < 0.01; ***P < 0.001; n.s., non-significant). The significance measured between vaccinated groups was indicated above horizontal lines. The significance measured between each vaccinated groups and the negative control (Ctrl) group after the boost immunization was indicated above each histogram bar. (C) HEp-2 cells were infected with RSV strain Long. Cell lysates were analyzed by Western blotting using pooled sera collected from N-, N-FsII- or postfusion F-immunized mice. The relative molecular mass (kDa) is indicated on the left. The band corresponding to F1 is indicated by an arrow.

