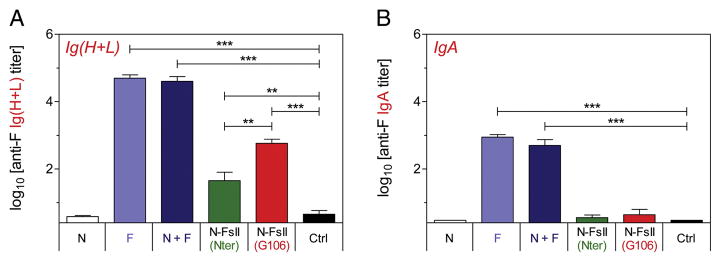
Figure 4. Measure of mucosal antibody responses.
Mice were immunized as described in Figure 3. Broncho-alveolar lavages were collected two weeks after the boost immunization. F-specific Ig (H + L) (A) and IgA (B) titers were determined by ELISA. Data are mean + SEM of individual titers (n = 5–6). P values were determined according to the Student’s t test (**P < 0.01; ***P < 0.001).

