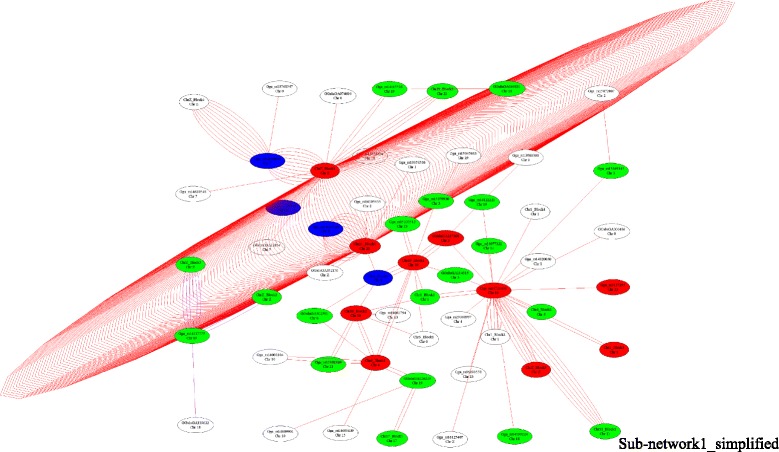
Fig. 1.

A simplified network of Sub-network1 using the LD information. The blocks are from the LD information in Additional file 3: Figure S2 and the lines between two nodes depicts an interaction between these two nodes. The colors of the nodes represent the P-value of an interaction (P < 1.0 × 10−16 = red; P < 1.0 × 10−15 = blue; P < 1.0 × 10−14 = green; P < 1.0 × 10−13 = white). The color of the edge indicates the type of epistatic effect (AA = red; AD = purple; DA = blue; DD = green)
