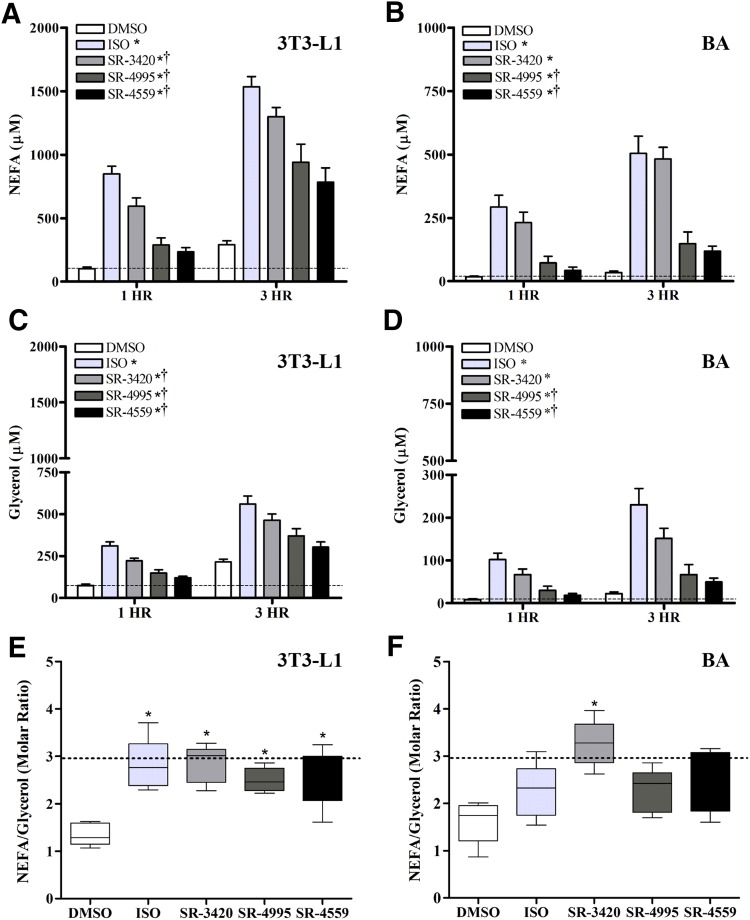
Fig. 2.
Time course of NEFA and glycerol release by ISO and ABHD ligands in 3T3-L1 and BA cells. Differentiated 3T3-L1 (A, C, and E) and BA cells (B, D, and F) were incubated in KRBB medium containing 1% FF-BSA and one of the following treatments: DMSO (0.2%), isoproterenol [10 nM (BA) or 10 µM (3T3-L1)], or an ABHD5 ligand (20 µM) for 3 hours, as described in Materials and Methods. Free fatty acids and glycerol were then measured in an aliquot of the culture medium after 1 and 3 hours. Each bar represents the mean ± S.E.M. Shown are representative results from five independent experiments per cell line. For both cell lines, there were significant differences detected among treatments and across time on both NEFA and glycerol levels (P < 0.05), but no significant interaction. In general, NEFA and glycerol levels were significantly higher at 3 hours compared with 1 hour (P < 0.05). Symbols denote statistically significant differences that were detected among the treatment groups (independent of time): *significantly different compared with DMSO controls (P < 0.05); †significantly different compared with isoproterenol (P < 0.05).

