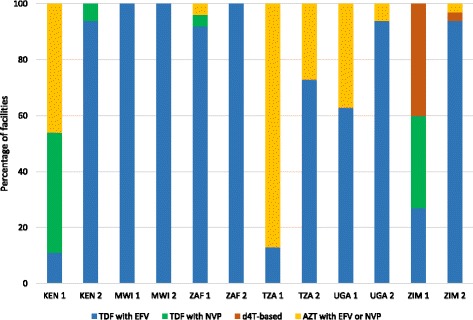
Fig. 3.

Proportion of health facilities starting patients on different ART regimens during the last three months, by country. *KEN 1-Kenya round 1 *KEN 2-Kenya round 2 *MWI 1-Malawi round 1 *MWI 2-Malawi round 2 *ZAF 1-South Africa round 1 *ZAF 2-South Africa round 2 *TZA 1-Tanzania round 1 *TZA 2-Tanzania round 2 *UGA 1-Uganda round 1 *UGA 2-Uganda round 2 *ZIM 1-Zimbabwe round 1 *ZIM 2-Zimbabwe round 2
