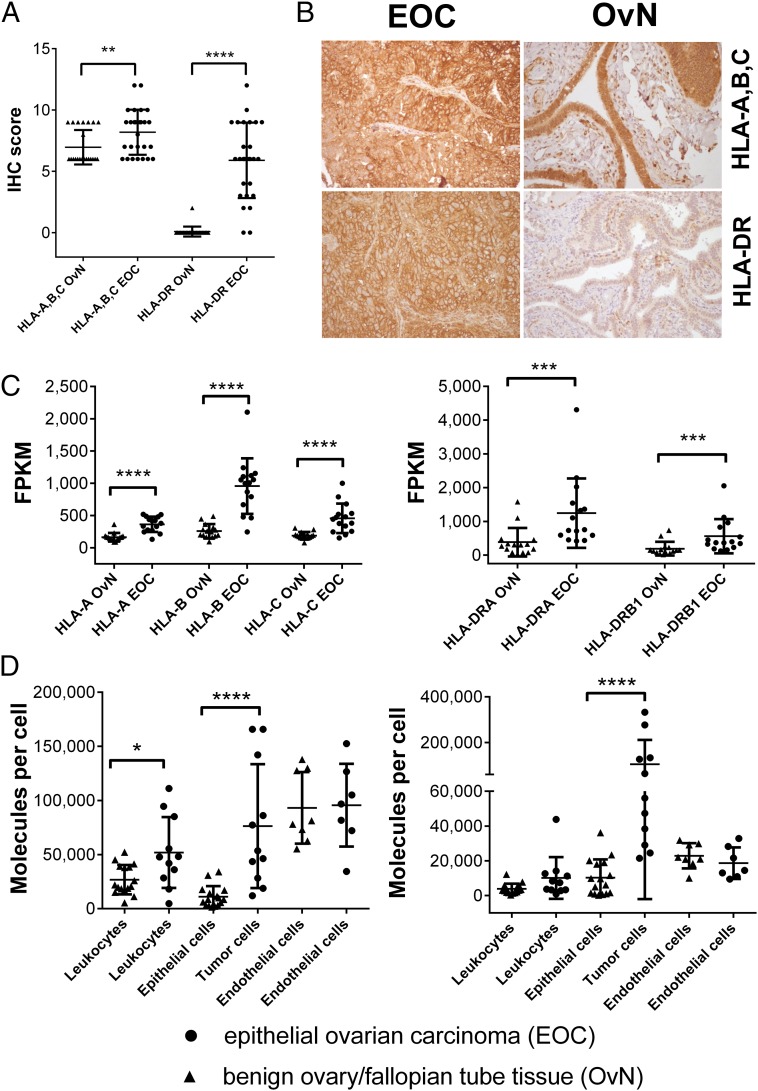
Fig. 1.
EOCs show an increased MHC class I and II expression. (A) IHC assessment of HLA-A, -B, -C (Ab clone H2A) and HLA-DR (Ab clone L243) expression on EOC (n = 27), as well as fallopian tube samples OvN (n = 24). (B) Representative photomicorgraphs of EOC and benign fallopian tubes after IHC stainings at 200× magnification. (C) Gene-expression analysis of HLA class I and HLA-DR genes. RNA-Seq was used to characterize gene expression, determined as FPKM values. Expression levels for HLA-DP/HLA-DQ genes can be found in Fig. S1. (D) HLA class I (Left, Ab clone W6/32) and HLA-DR (Right, Ab clone L243) expression on different cell types within EOC and benign ovarian/fallopian tissue after enzymatic dissociation. Individual cell populations were characterized by distinct cell surface markers (leukocyte compartments: CD45+, tumor cells/epithelial cell compartments: CD45−EpCAM+, endothelial cell compartments: CD45−CD31+). Quantification of cell-type–specific surface expression was performed using a bead-based standard (QIFIKIT) (see SI Methods). Each data point represents the mean of triplicate experiments performed for each sample. For an overview on the gating strategy and the outlined process, see Fig. S2. Raw values for median fluorescence intensity and calculated copy numbers per cell can be found in Dataset S2. Throughout the figure, nonparametric Mann–Whitney test was used to test for significance (*P < 0.05; **P < 0.01, ***P < 0.001, ****P < 0.0001) due to rejected normality test (D’Agostino and Pearson). Data points represent individual samples unless stated otherwise. Horizontal lines indicate mean values ± SD.

