Fig. 2.
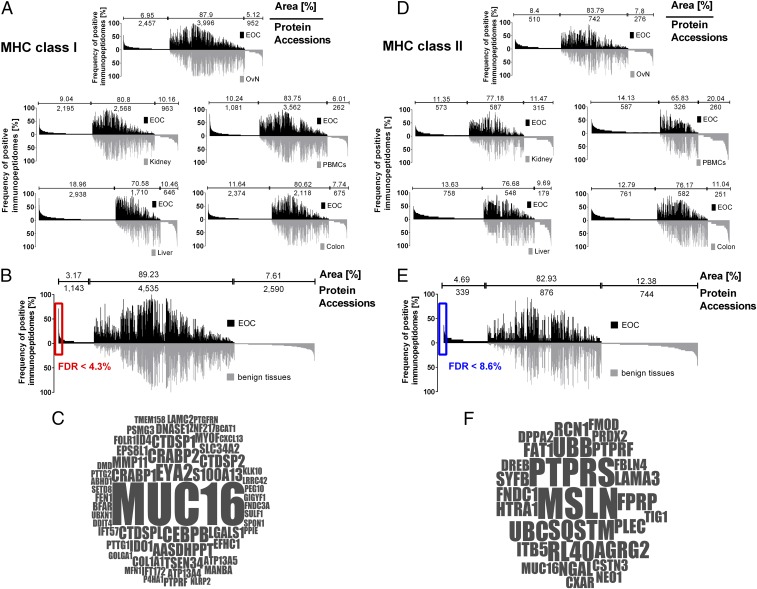
Immunopeptidome analysis of EOC and comparative profiling to various benign tissues. (A) Comparative profiling and overlap analyses of HLA class I ligand source proteins of EOC (n = 42) in comparison with benign ovary/fallopian tube tissue (n = 23), benign kidney tissue (n = 20), healthy donor PBMCs (n = 30), benign liver tissue (n = 15), and benign colorectal tissue (n = 20). Profiling is based on the frequency of positive immunopeptidomes (i.e., HLA-restricted representation of ligand source proteins within the different cohorts), as indicated on the y axis. The number of ligand source proteins that are unique to either EOC or benign tissues, as well as the number of shared source proteins, is indicated above each graph, together with the respective area under the curve in percentage of total area (i.e., number of ligand source proteins × frequency of presentation of each source protein). To cope with differences in the depth of sample analyses (i.e., number of identified peptides per sample in EOC vs. benign tissues) peptide identifications for EOC were ranked according to abundance (i.e., area of the peptide ID) and artificially truncated to the median number of peptide identifications of respective benign tissues. (B) Comparative profiling and overlap analysis of HLA class I ligand source proteins of EOC in comparison with the entirety of benign tissues, deliberately excluding benign ovarian/fallopian tube tissue during comparative profiling to avoid loss of differentiation antigens possibly shared among tumor and benign ovarian tissues. Differences in the depth of sample analysis were addressed by ranking and artificially truncating the EOC dataset to the median number of peptide identification of benign tissues. Number of protein accessions and area (%) are presented accordingly. The significance threshold for exclusively presented proteins (FDR) was calculated by comparing the number of EOC exclusively presented HLA ligand source proteins at different presentation frequencies in the investigated cohort to a virtual cohort generated by in silico-based random weighted sampling from the entirety of protein identifications of both original cohorts. The in silico-generated randomized immunopeptidomes are of the same size and number of proteins as the real cohorts, but their origin (i.e., whether they are presented on EOC or benign tissues) is ignored for this analysis. Randomization of HLA ligand source proteins, cohort assembly, and assessment of exclusively presented HLA ligand source proteins was repeated 1,000 times. The mean value of resulting exclusively presented antigens, which randomly associate with either cohort, is then compared with the number of exclusively presented antigens in the original cohort at different presentation frequencies. A minimal threshold for HLA class I ligand source proteins exclusively presented on EOC of >10% (≥5 samples) presentation frequency was chosen with a corresponding FDR of 0.043 (4.3%). Gene names of respective source proteins are presented in a word cloud in C. The size of the font correlates with the presentation frequency in the EOC cohort. (D) Comparative profiling and overlap analyses of HLA class II ligand source proteins of epithelial ovarian cancer (EOC, n = 30) in comparison with benign ovary/fallopian tube tissue (n = 19), benign kidney tissue (n = 15), healthy donor PBMCs (n = 15), benign liver tissue (n = 10), and benign colorectal tissue (n = 15). Differences in the depth of sample analysis are adjusted using the same approach as in A and B. (E) Comparative profiling and overlap analysis of HLA class II ligand source proteins of EOC in comparison with the entirety of benign tissues deliberately excluding benign ovarian tissue samples during comparative profiling to avoid losing differentiation antigens possibly shared among tumor and benign ovarian tissues. Differences in the depth of sample analysis were adjusted (A and B). A minimal threshold exclusively on EOC-presented HLA class II ligand source proteins of >10% (≥4 samples) presentation frequency was chosen with a corresponding FDR of 0.086 (8.6%). Gene names of respective source proteins are presented in a word cloud in F. The size of the font correlates with the presentation frequency in the EOC cohort.

