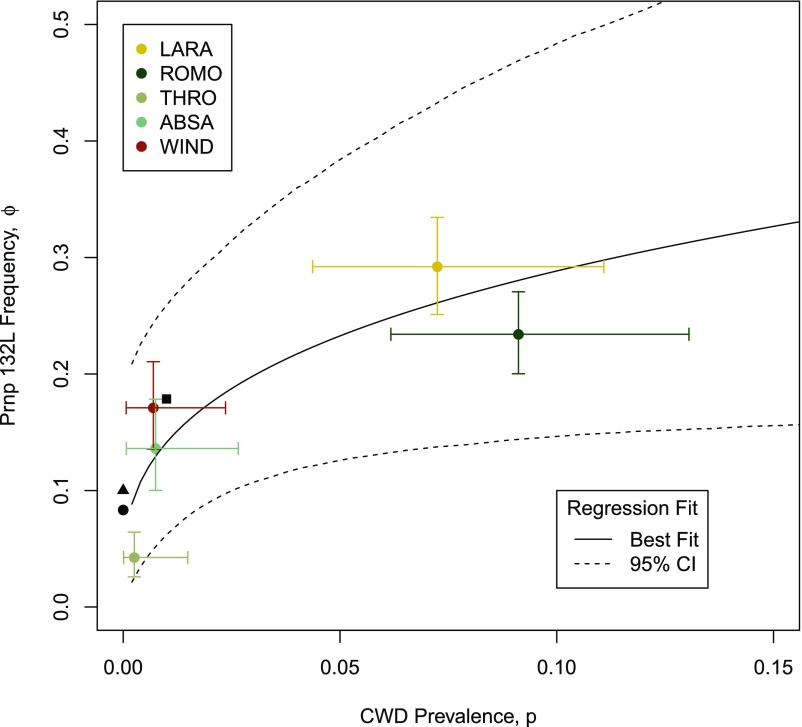
Fig. 1.
Regression of derived predicted mean allele frequency based on CWD prevalence (solid line) and model results for the five elk populations included in analyses (whisker plots showing 95% CI). Two of the elk populations have been exposed to CWD for at least 30–50 y (LARA and ROMO), while the disease has never been detected in the other three populations (WIND, THRO, and ABSA). Data extracted from other elk populations are shown for comparison but not included in analyses (■ = Colorado, ▲ = Wyoming, ● = South Dakota; refs. 12 and 16).

