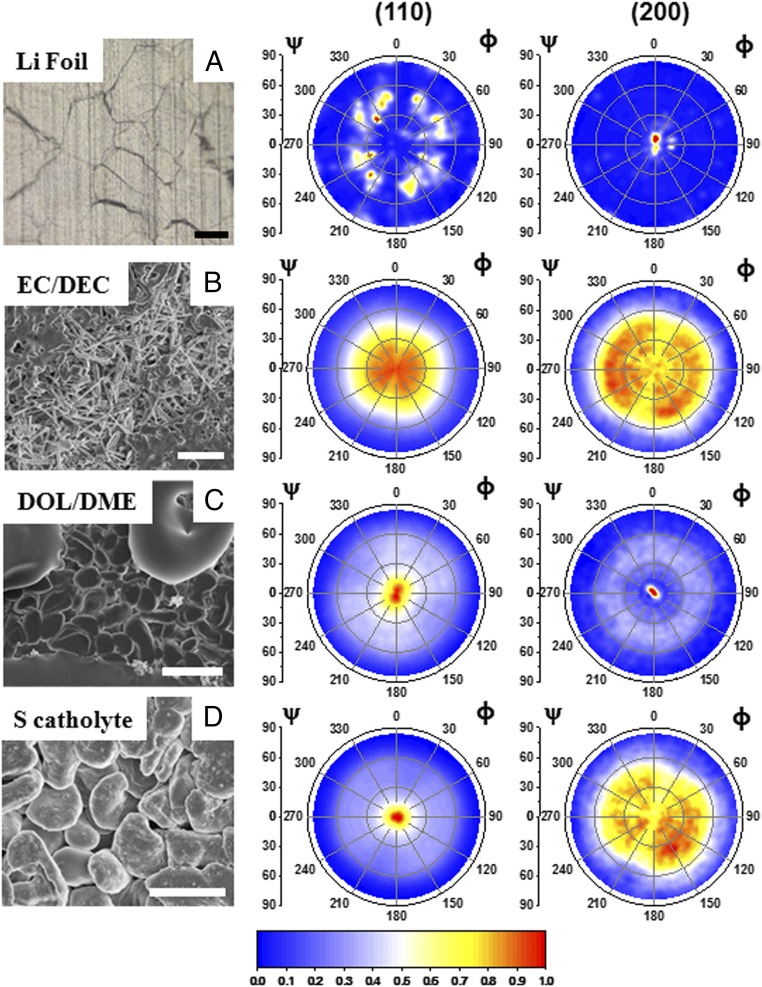
Fig. 3.
Pole-figure analysis of Li films. (A) Li foil; (B) Li deposit in EC/DEC 1 M LiPF6; (C) Li deposit in DOL/DME 1 M LiTFSI, 1% LiNO3; and (D) Li deposit in sulfur catholyte 5 M S8 dissolved in DOL/DME 1 M LiTFSI, 1% LiNO3. All of the absorbance intensities are normalized to its largest value. (Scale bar: 20 µm.)

