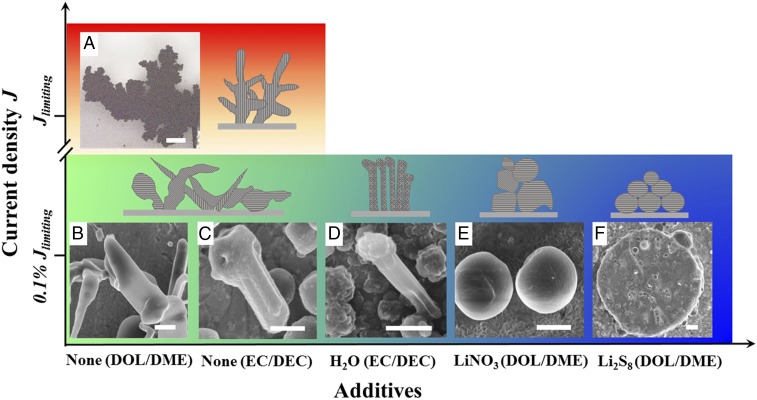
Fig. 4.
Growth of lithium electrodeposits as a function of current density J and additives in electrolyte. Characteristic images of Li deposits (with schematics on the right-hand side or above) are plotted based on the current density and additive type, with inhibition intensity increasing in the horizontal direction. (A) Exceeding diffusion-limited current density Jlimiting, optical image of dendritic and ramified Li deposit in EC/DEC 1 M LiPF6, below 0.1% of diffusion-limited current density Jlimiting. SEM images of lithium deposit in (B) DOL/DME 1 M LiTFSI; (C) EC/DEC 1 M LiPF6; (D) EC/DEC 1 M LiPF6, 100 ppm H2O; (E) DOL/DME 1 M LiTFSI, 1% LiNO3; and (F) sulfur catholyte, 5 M S8 dissolved in DOL/DME 1 M LiTFSI, 1% LiNO3. (Scale bar: A, 200 μm; B, E, and F, 2 μm; C and D, 1 µm.)

