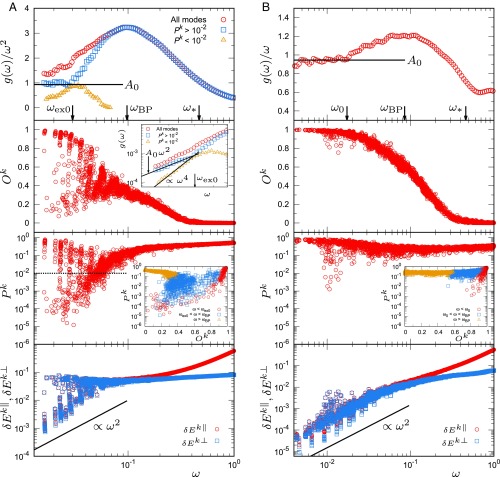
Fig. 1.
Vibrational modes in the model amorphous solid. Plots of and of the , , , and of each mode as functions of . (A) The 3D model system (). (B) The 2D model system (). The packing pressure is . Inset in the third image from the top in A and B presents the plot of vs. . For the 3D system in A, , the vDOS of extended modes () and , which is that of localized modes (), are also presented in A in the top image and Inset of the second image from the top.

