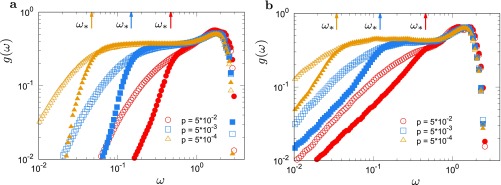
Fig. S1.
The onset frequency of the plateau in vDOS. Plot of the vDOS against . (A) The 3D model system. (B) The 2D model system. The data of the original (stressed) system (open symbols) and of the unstressed system (filled symbols) are presented. The packing pressures are , , and . The onset frequency of the plateau is indicated by arrows.

