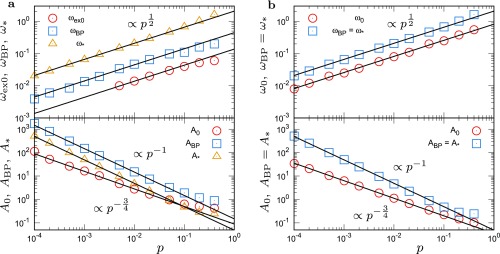
Fig. S7.
Dependence on of frequencies and amplitudes of the vDOS for the 3D model system. Plots of the characteristic frequencies, (), , and , and the corresponding amplitudes of , , , and A∗, as functions of . (A) Original (stressed) system. (B) Unstressed system. The lines indicate the power-law scalings with .

