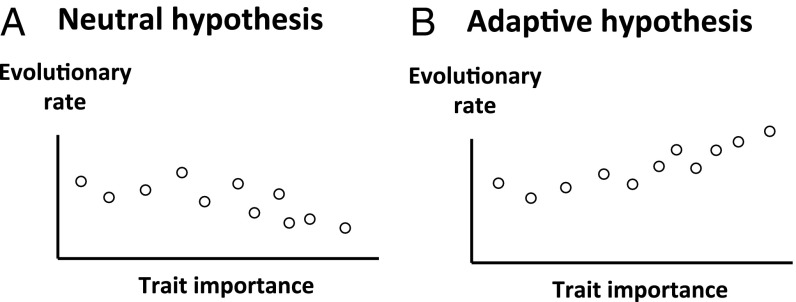
Fig. 1.
Schematic illustrating the test of the neutral hypothesis of phenotypic evolution by comparing evolutionary rates among traits of different levels of importance. (A) Under the neutral hypothesis, relatively important traits evolve more slowly than relatively unimportant traits. (B) Higher evolutionary rates of more important traits reject the neutral hypothesis and support the adaptive hypothesis. Each circle represents a trait.

