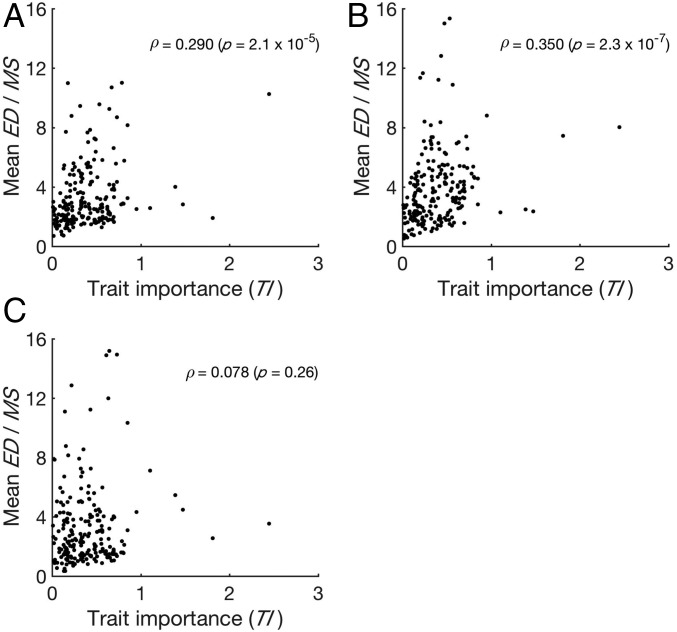
Fig. 3.
Adaptive morphological evolution between Saccharomyces species. (A) The mean ED/MS between 37 natural S. cerevisiae strains and S. paradoxus strain N17 for a trait increases significantly with TI. (B) The mean ED/MS between 37 natural S. cerevisiae strains and the S. paradoxus strain IFO1804 increases significantly with TI. (C) The mean ED/MS between 37 natural S. cerevisiae strains and S. mikatae increases (but not significantly) with TI. Each dot represents a morphological trait.

