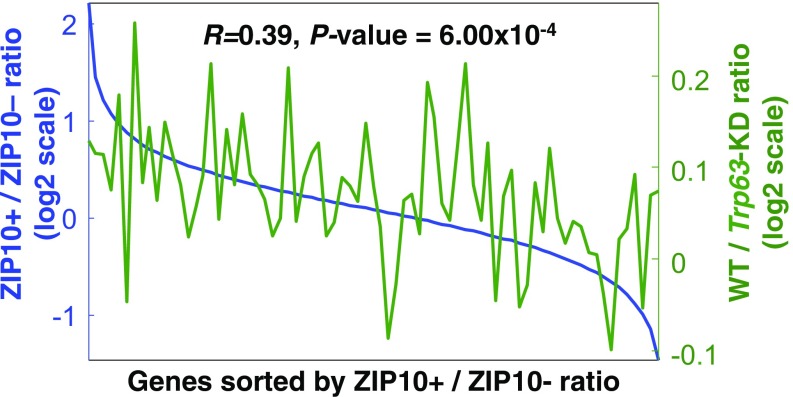
Fig. S3.
Changes in gene expression between ZIP10 dependency and p63 dependency. Comparative analysis of the gene expression profiles between the log2-fold differences in ZIP10+/ZIP10− cells and in WT/Trp63-KD skin. The gene expression microarrays for WT and Trp63-KD skin were obtained from GEO (GSE3108). The x axis shows the sorted genes according to the magnitude of log2-fold changes in ZIP10+ versus ZIP10− cells. The Left y axis indicates the average log2-fold changes in ZIP10+ versus ZIP10− cells for individual bins of the sorted genes (100 genes/bin); the Right y axis indicates the average log2-fold changes in WT versus Trp63-KD skin for the genes in the individual bins defined by the ZIP10 comparison.

