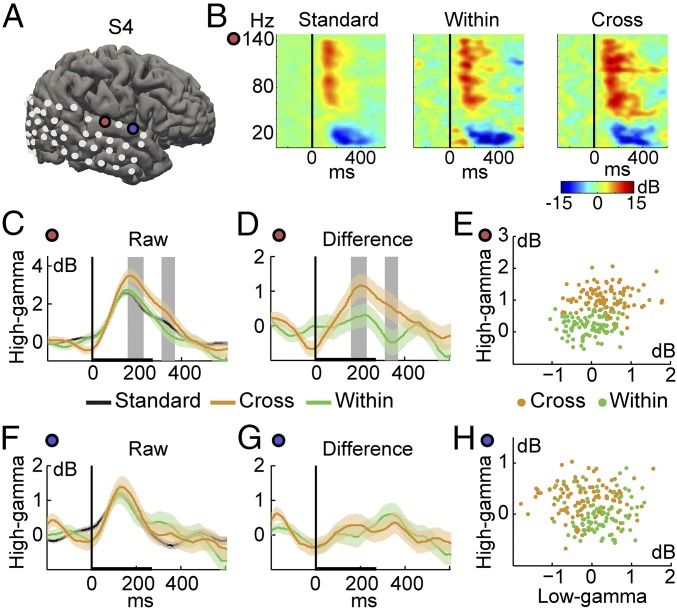
Fig. 2.
Enlarged cross-category neural dissimilarity. (A) Electrode locations on subject S4’s reconstructed cortical surface with examples of categorical (red circle) and noncategorical (blue circle) electrodes. (B) Event-related spectrograms for three stimuli in the oddball paradigm from the red electrode, averaged across trials and normalized to the baseline power. Black vertical lines indicate the onset of the auditory stimuli. (C and F) High-gamma responses for standard stimuli (black curve), cross-category deviant stimuli (orange), and within-category deviant stimuli (green). (D and G) Difference waveforms for cross-category contrast (orange) and within-category contrast (green). Gray area indicates significantly larger high-gamma responses for cross-category than for within-category stimuli (mean± SEM, Wilcoxon rank-sum test, *P < 0.05). (E and H) Neural responses dissimilarity in 2D space of high-gamma and low-gamma band power, for categorical electrode (E) and noncategorical electrode (H). Each dot represents an averaged bootstrap resample of 50% trials’ mean response.

