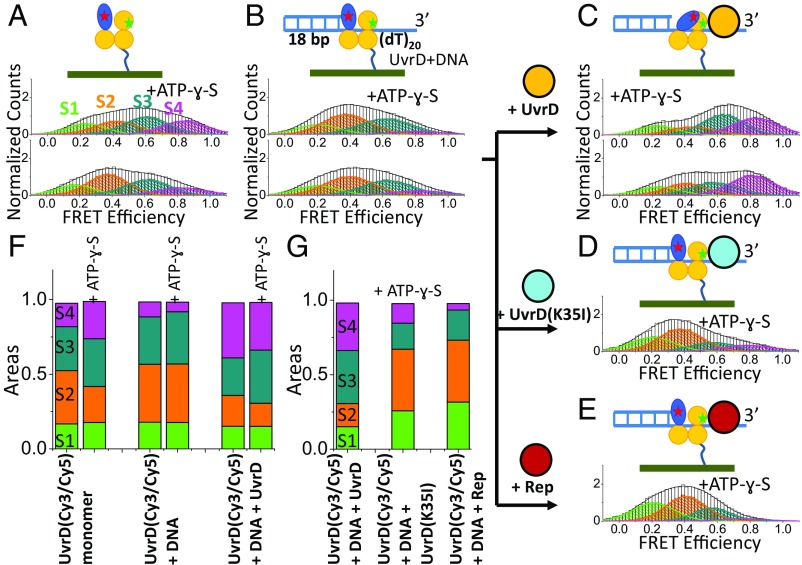
Fig. 3.
Effects of binding of DNA, ATP-ɣ-S, and a second UvrD molecule on the 2B conformational state distribution. (A) FRET histogram of labeled UvrD(A100C, A473C) with 0.5 mM ATP-ɣ-S (n = 72) or without (n = 55). (B) FRET histogram upon addition of 300 nM 3′(dT)20ds18 bp to A with (n = 48) or without ATP-ɣ-S (n = 89). (C) FRET histogram upon addition of 0.5 µM wtUvrD to B greatly enhances the S4 population in the presence (n = 54) or absence (n = 69) of ATP-ɣ-S. (D) FRET histogram upon addition of 0.5 µM UvrD(K35I) to B (n = 43). (E) FRET histogram upon addition of 1.0 µM Rep to B (n = 45). (F) Populations of the four substates for the experiments in A–C with or without ATP-ɣ-S. (G) Populations of the four substates for the experiments in C–E in the presence of ATP-ɣ-S.

