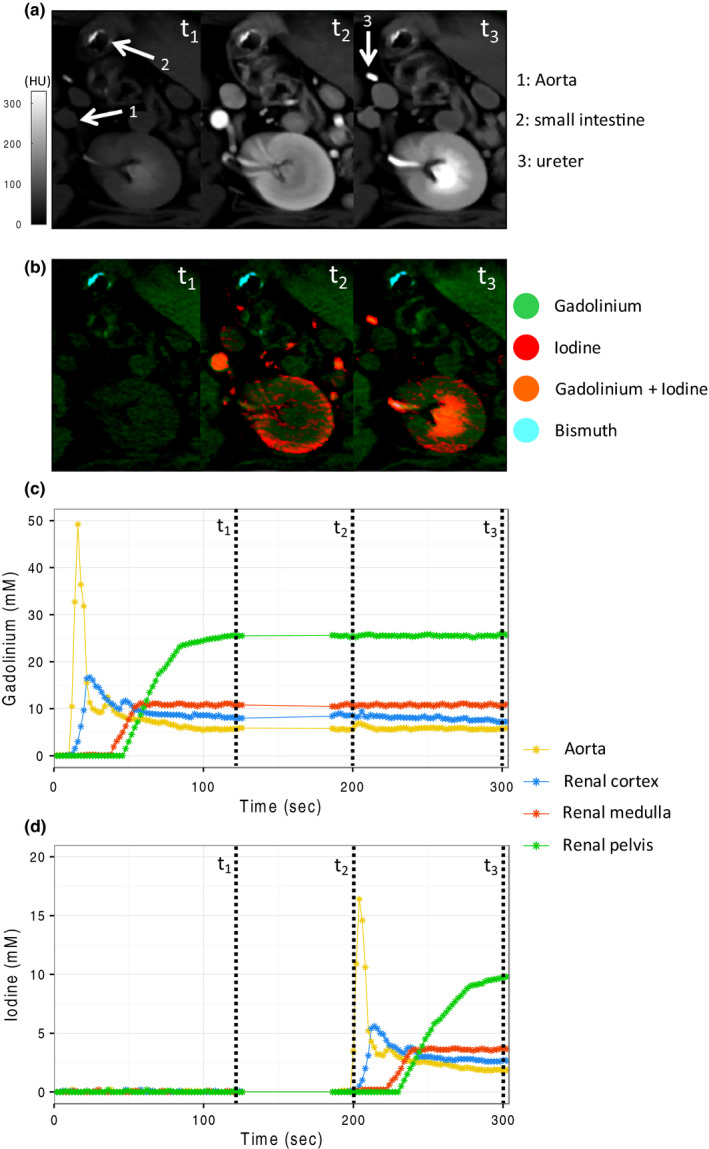
Figure 4.

Grayscale images (a) and multimaterial maps (b) at three time points during the scan protocol: t1 = gadolinium excretory phase (120 s after gadolinium injection); t2 = iodine arterial phase, gadolinium excretory phase (200 s after gadolinium injection, 20 s after iodine injection); t3 = iodine and gadolinium excretory phase (300 s after gadolinium injection, 120 s after iodine injection). Differentiation between the three contrast agents is possible on the multimaterial maps. Time‐concentration curves for gadolinium (c) and iodine (d) in the aorta, renal cortex, renal medulla, and renal pelvis show clear differentiation of the contrast materials.
