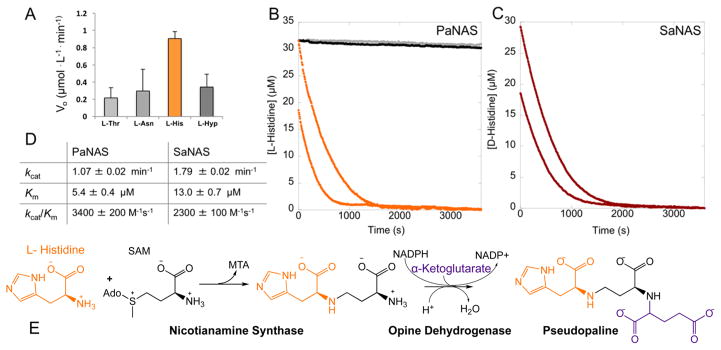
Figure 3.
(A) P. aeruginosa screening. Each enzyme (2 μM), NADPH (75 μM), an amino acid (200 μM each), α-ketoglutarate, and SAM were combined in 50 mM KPi pH 8 buffer (Hyp is L-hydroxyproline). (B) P. aeruginosa NAS full progress curves. No amino acid (0 μM, black), 25 μM L-Thr, L-Asn, or L-Hyp (gray), or 25 μM (orange, top) or 12.5 μM L-histidine (orange, bottom) was combined with 2 μM PaNAS, 20 μM PaODH, 200 μM NADPH, 400 μM SAM, and 400 μM α-ketoglutarate in 50 mM KPi pH 8 buffer. L-Thr and L-Asn were omitted for the sake of clarity as they overlay with the 0 μM control. (C) S. aureus NAS full progress curves. D-Histidine at 25 μM (red, top) or 12.5 μM (red, bottom) was combined with 2 μM SaNAS, 20 μM SaODH, 200 μM NADPH, 400 μM SAM, and 400 μM pyruvate in 50 mM Tris pH 8 buffer. (D) NAS kinetic parameters. Determined by fitting the Michaelis–Menten equation to a secondary plot of initial rates for varying concentrations of L-His (PaNAS) or D-His (SaNAS). Error propagated on the basis of the standard deviation of four trials. (E) Pseudopaline biosynthesis.

