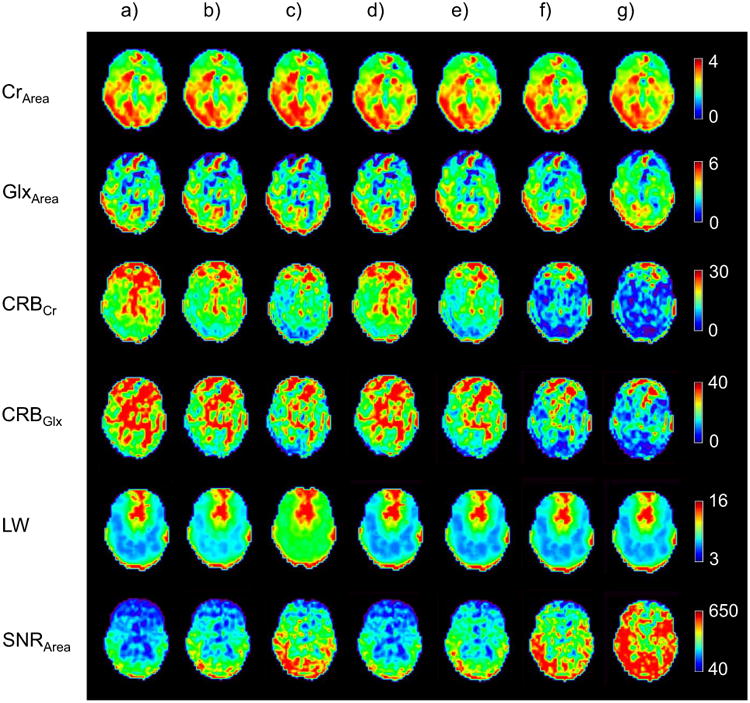
Fig. 4.

Images of denoising results for a mid-axial slice for a volumetric MRSI study of a normal subject. Results from the spectral fitting are shown in each row for different processing in each column for (a) acquired data with no spectral smoothing, (b) Gaussian apodization (2 Hz), c) Gaussian apodization (5 Hz), d) PCA denoising using the first 224 PCs, e) SSPC denoising with threshold of 1E-5 (the algorithm found 224 PCs for this threshold), and f) PCA denoising using the first 65 PCs, g) SSPC denoising with threshold of 1E-10 (the algorithm found 65 PCs for this threshold)
