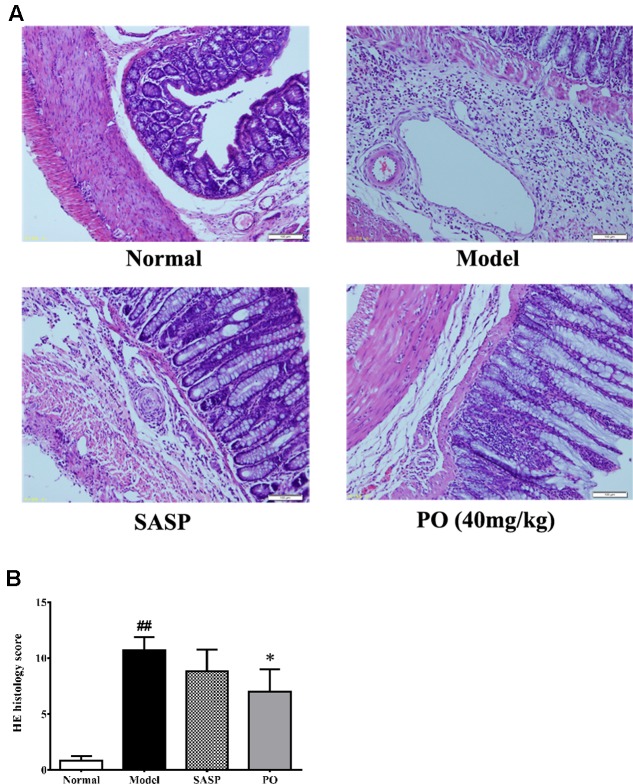
FIGURE 3.
Histological evaluation for inflammatory lesion in colon tissue. (A) Representative HE staining picture for colon from each group (400× magnification). (B) Histology scores for tissue injuries from each group. Values were represented the means ± SD (n = 6). #p < 0.05 and ##p < 0.01 versus Normal group, ∗p < 0.05 and ∗∗p < 0.01 versus Model group.

