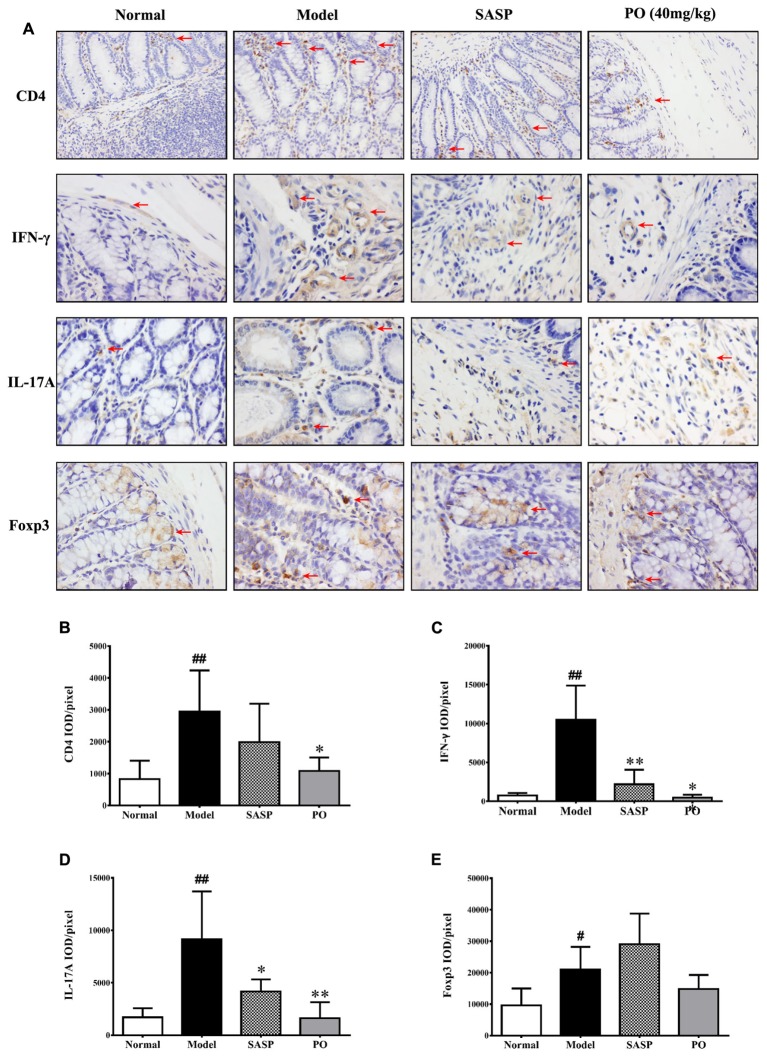
FIGURE 4.
Immunohistochemistry detection for related proteins of Th cells. (A) Representative IHC picture (400× magnification) for CD4 (Th), IFN-γ (Th1), IL-17A (Th17), and Foxp3 (Treg), the positive area was indicated by red arrows. (B–E) The mean ratios of integrated optical density (IOD) to area (IOD/pixel) were used for analyzing the results of immunohistochemistry. Values were represented the means ± SD (n = 6). #p < 0.05 and ##p < 0.01 versus Normal group, ∗p < 0.05 and ∗∗p < 0.01 versus Model group.

