
Figure 1.
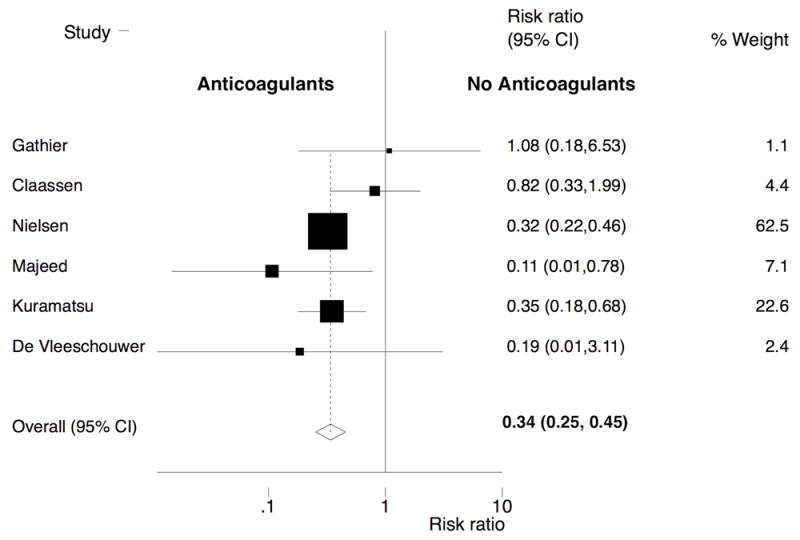
Forest plot of the association between resumption of oral anticoagulation therapy and arterial thromboembolic complications after intracranial hemorrhage. The meta-analysis was calculated using a random-effects model, with the pooled relative risk shown in the forest plot. Each square represents the point estimate of any given study’s effect size. The size of the squares is proportional to the inverse of the variance of the estimate, while the horizontal lines represent each study’s 95% confidence intervals. The diamond represents the pooled estimate with the width of the diamond representing the pooled 95% CI. Heterogeneity: Q = 5.12; P = 0.28.