
Figure 1. Smurf1 Functions in Selective Autophagy of M. tuberculosis and the Control of M. tuberculosis Replication.
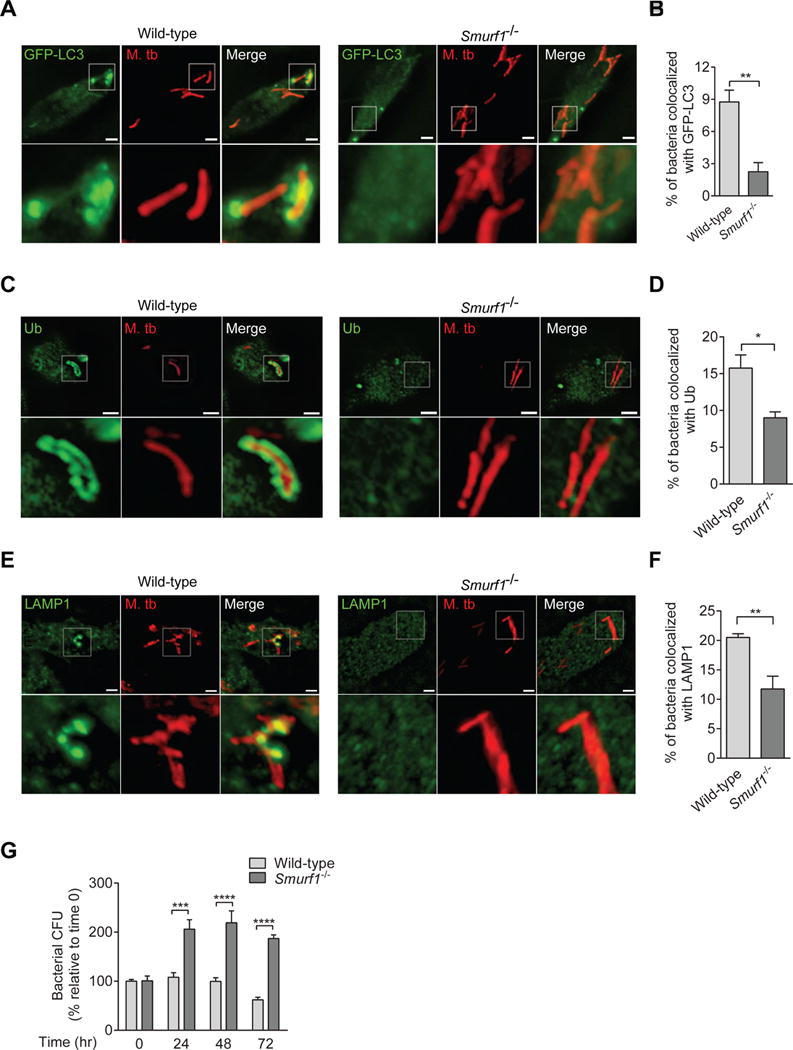
(A–F) Photomicrographs (A, C, E) and quantitation (B, D, F) of the colocalization of mCherry-Mtb and GFP-LC3 (A, B), polyubiquitin (C, D) or LAMP1 (E, F) 15 hr after infection of BMDMs from wild-type or Smurf1−/− mice. Insets show representative mycobacteria that would be considered colocalized with respective markers in wild-type BMDMs or not colocalized in Smurf1−/− BMDMs. Scale bars, 3 μm. See also Figure S1.
(G) Mycobacterial growth in wild-type or Smurf1−/− BMDMs infected with Mtb. Infected cells were lysed at the indicated time-points and mycobacterial growth was determined by counting colony-forming-units (CFUs). Bars are mean ± SEM of quadruplicate samples; each sample was normalized to day 0. Similar results were observed in three independent experiments. ***P<0.01; ****P<0.0001 for indicated comparison; two-way ANOVA.
For B, D and F, bars are mean ± SEM of quadruplicate samples (100 bacteria evaluated per sample per genotype) from a representative experiment. Similar results were observed in at least three independent experiments. *P<0.05, **P<0.01, for indicated comparison; t-test.