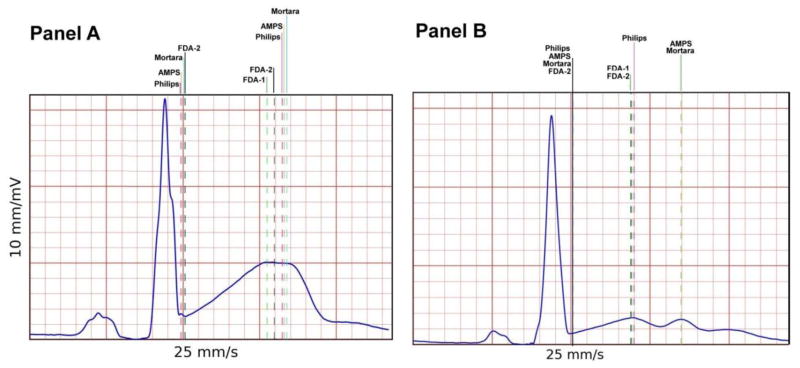
Figure 4.
Two examples of median beats extracted from the quinidine arm where vertical lines indicate the location of the J point and T-apex across the submitted technologies. These examples illustrate the behavior of the various technologies for abnormal T-wave morphology and specifically a T-wave with a plateau phase (Panel A), and a flat, double bumped T-wave (Panel B).

