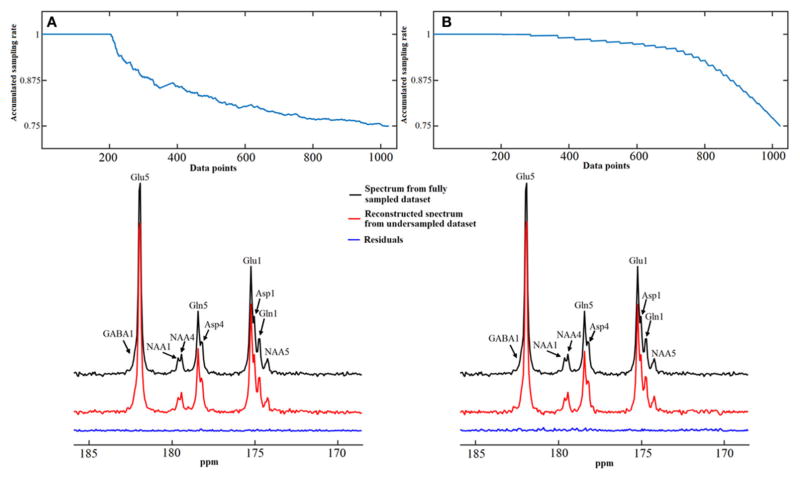
FIGURE 12.
Spectra reconstruction using time-domain random under-sampling strategies. Examples of data reconstruction using the total random sampling pattern (A) and coherent sampling pattern with gradually decreasing under-sampling rate (B). The sampling patterns from top display accumulated sampling rate over sampled data points. The last point of sampling pattern represents the overall under-sampling rate, which is 25%. Both methods began with a 20% fully sampled core. Adapted from Li et al. [36].

