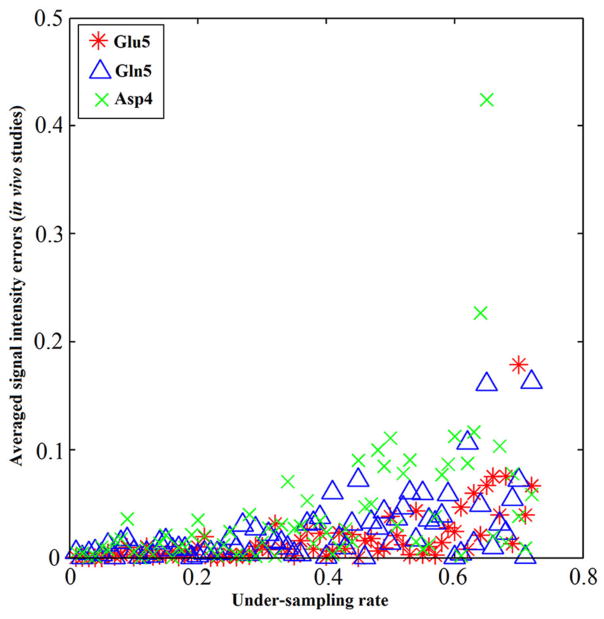
FIGURE 15.
Metabolite concentrations vs. under-sampling rate from in vivo studies. The absolute value of signal intensity errors averaged over 4 different subjects of Glu C5 (star), Gln C5 (triangle), and Asp C4 (cross) increases as the under-sampling rate increases. The signal intensity errors for all three tested chemicals are within 5% when the under-sampling rate is less 32% in general. Similar increase trends of signal intensity errors were observed across all three chemicals as the under-sampling rate increases. Adapted from Li et al. [36].

