
Figure 7.
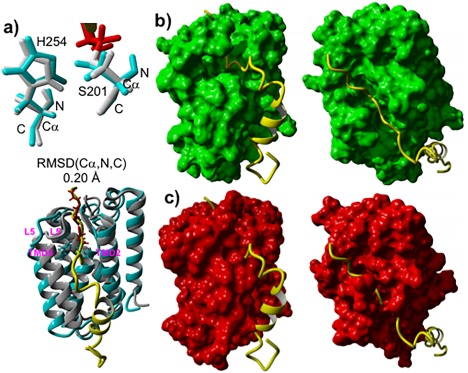
Comparison of 3D structures of GlpG complexes: TC (5f5b.pdb) formed with Ac‐VRMA‐CHO peptidyl aldehyde covalent inhibitor versus MD generated pre‐catalytic non‐covalent complex conformational cluster centroid relevant to the peptide catalytic hydrolysis formed with 33‐pep substrate. (A): Superposition on the Cα, N, C backbone atoms of S201 and H254 catalytic residues of GlpG in TC (grey) with GlpG in the pre‐catalytic non‐covalent complex (cyan), inhibitor colored in red. (B): Frontal and top view of the alignment of 33‐pep (yellow) in the non‐covalent complex molecular surface of GlpG (green). (C): Frontal and top view of the alignment of 33‐pep (yellow) in the TC crystal structure molecular surface of GlpG (red).