
Figure 1.
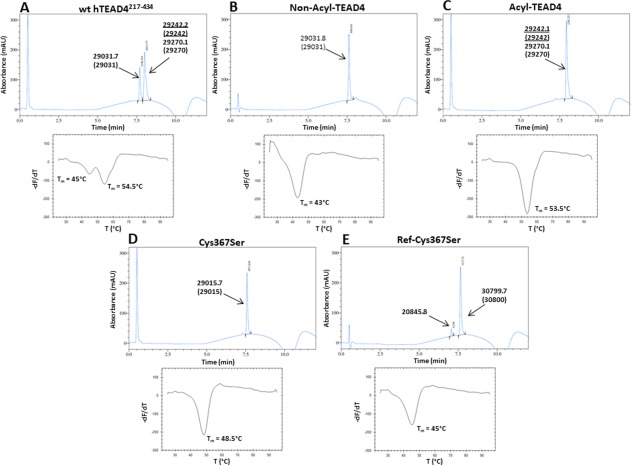
Analytics of the different TEAD4 proteins. Upper panels, representative chromatograms obtained by RP‐HPLC. The molecular weights measured in mass spectrometry of the protein species are indicated, and the theoretical molecular weights are given in brackets. Two different acylated forms were detected for wt hTEAD4217–434 (A) and Acyl‐TEAD4 (C). Underlined: Myr‐TEAD4 (major species), normal fonts: Palm‐TEAD4 (minor species). (E) The peak with a mass of 20845.8 is a minor impurity. Ref‐Cys367Ser has a larger mass than the other TEAD4 proteins, because its His6‐tag has not been cleaved off. Lower panels, representative thermograms obtained in a FTDA in the presence of 1–2 µM protein. The melting temperatures (T m) were obtained by plotting the first derivative of the fluorescence emission (F) as a function of the temperature (–dF/dT). The curve minimum corresponds to T m. The indicated T m have been measured for the experiments depicted on the figure. These T m are slightly different from the T m presented on Table II because these later are the average values obtained from several independent measurements.