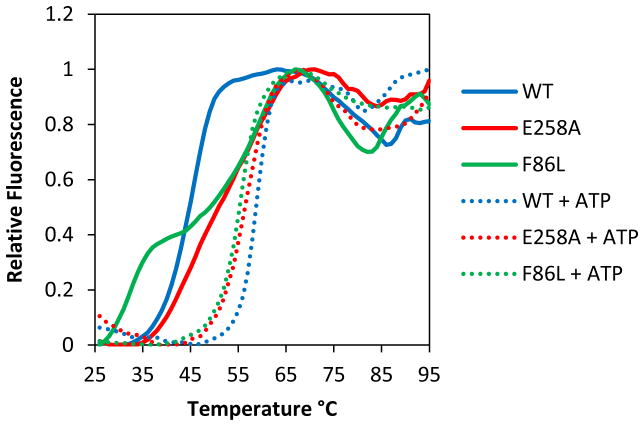
Figure 4. Thermal stabilities of RAD51 wild-type (WT), F86L and E258A variant proteins in the presence and absence of ATP.
Thermofluor assays to determine melting curves and Tm values (± standard deviation) were as described in Materials and Methods. Relative fluorescence is normalized to the highest signal in each curve. Solid lines represent melting curves in the absence of ATP for RAD51 WT (blue), E258A (red), and F86L (green), respectively. Dotted lines represent melting curves in the presence of 2 mM ATP for RAD51 WT (blue), E258A (red), and F86L (green), respectively.

