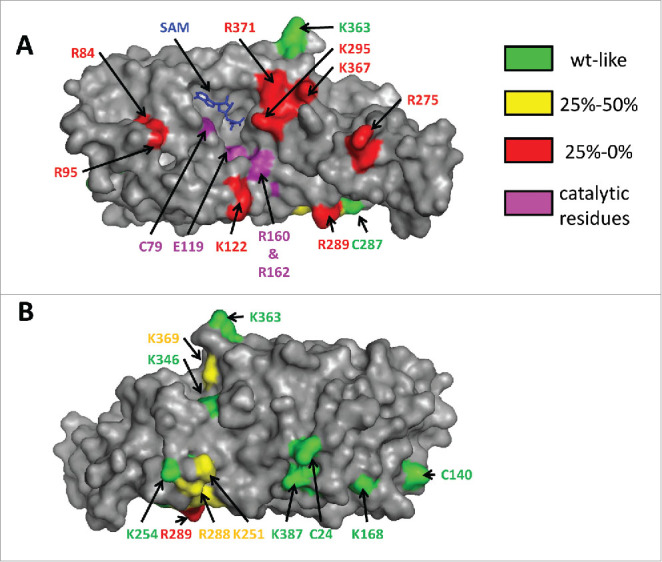
Figure 4.

Different views of DNMT2 in surface representation. The residues subjected to mutagenesis are colored according to their residual activity. The cofactor product S-adenosyl-l-homocysteine is colored blue. Panel A shows that residues which strongly interfere with catalysis (colored red here) cluster on the “front” face of the enzyme and surround a cleft that also contains the SAM binding pocket and the catalytic residues. Panel B represents a view of the “back side” of the enzyme after a 180° rotation of the view shown in panel A about the vertical axis. Reproduced from48 with permission. Copyright (2012) American Chemical Society.
