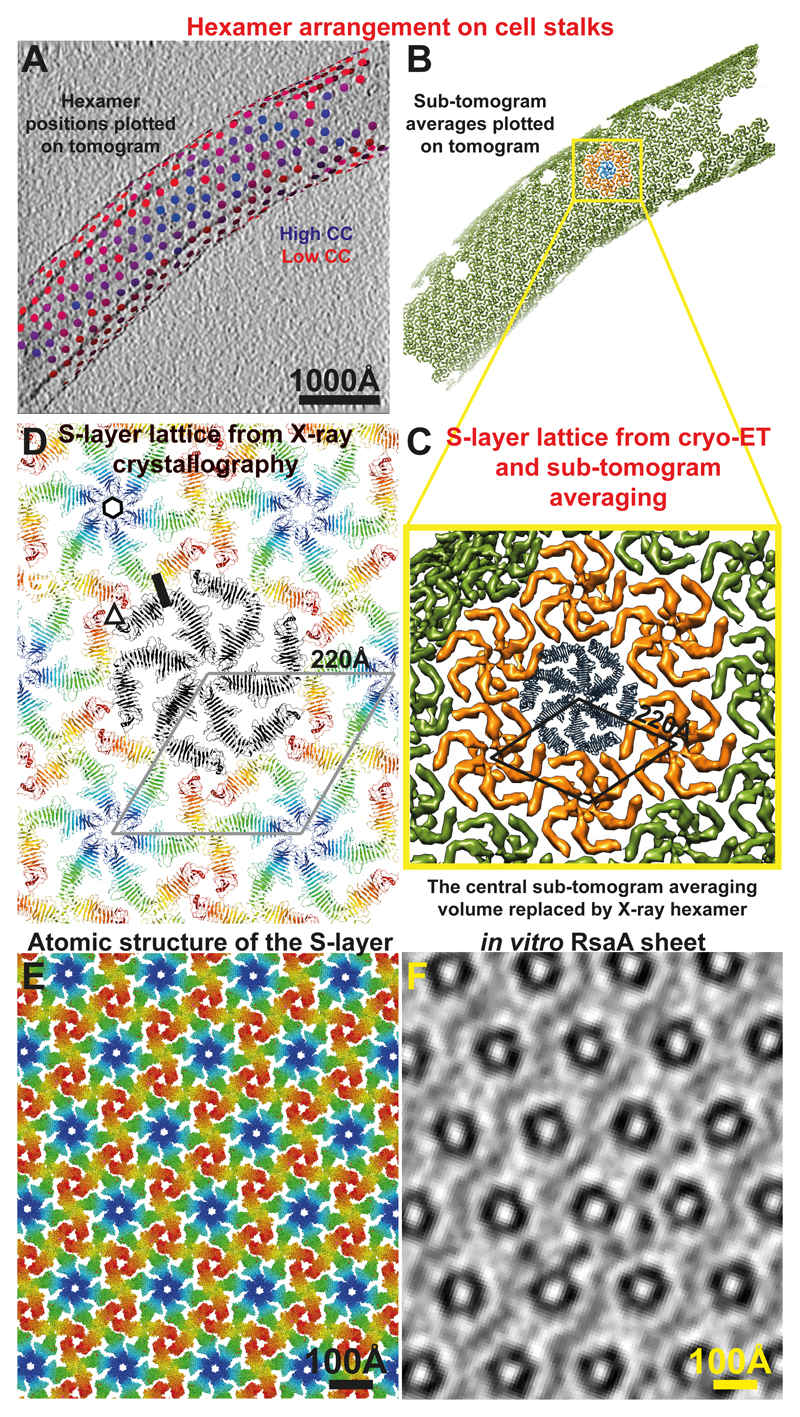
Figure 4. The S-layer lattices observed in the X-ray structure and the cryo-ET map are exceptionally similar.
(A) Final refined positions of sub-tomograms are shown plotted back onto a tomogram of a cell stalk with the corresponding refined orientations (see Movie S7). Positions have been coloured from blue (high cross-correlation of alignment) to red (low cross-correlation). One slice of the tomogram is shown with protein density black. (B) The same plot as panel A, except each hexamer position is illustrated with the sub-tomogram average (green volumes). One hexamer is highlighted in blue, and the hexamers directly contacting it are shown in orange. (C) A zoomed view of the hexameric lattice revealed by cryo-ET and sub-tomogram averaging. The 220 Å hexamer:hexamer spacing is highlighted. The central blue hexamer from panel B is replaced by one copy of the X-ray hexamer. (D) The RsaA lattice formed in the crystals through crystal packing is the same as the S-layer lattice observed on cells through cryo-ET. The 220 Å hexamer:hexamer repeat is shown. One hexameric, trimeric and dimeric interface, each have been highlighted with a black hexagon, a triangle and a line, respectively. In conclusion, both X-ray crystallography and cryo-ET used in this study show essentially the same lattice and arrangement of RsaA in C. crescentus S-layers. Also see Movies S4, 7. (E) Atomic structure of the S-layer. (F) A slice through an in vitro assembled RsaA sheet (see Movie S2) for comparison at the same scale as panel E.

