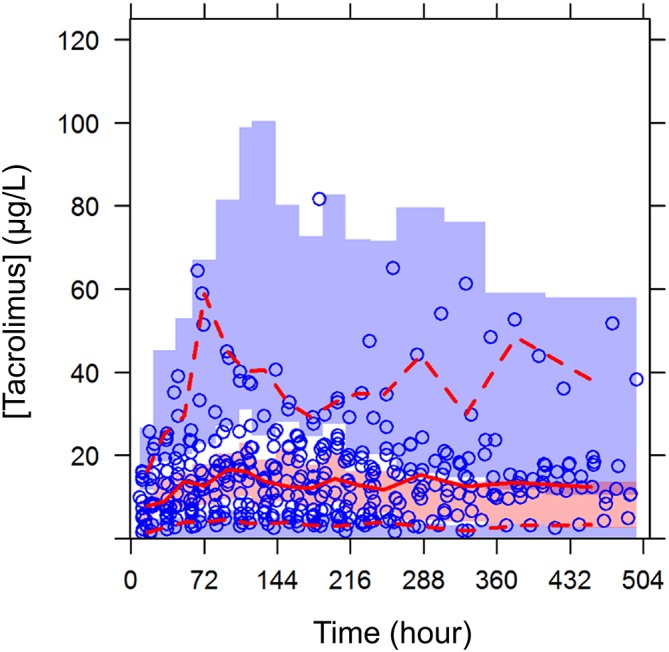
Figure 2.

Prediction corrected visual predictive check showing observed data concentrations (blue circles) and percentiles (red dashed lines: fifth and 95th percentile, red solid line: 50th percentile) versus time. Shaded area reflects the simulated concentrations and the respective 95% CI at the fifth and 95th percentile (black dashed line, blue shading) and 50th percentile (black solid line, pink shading).
