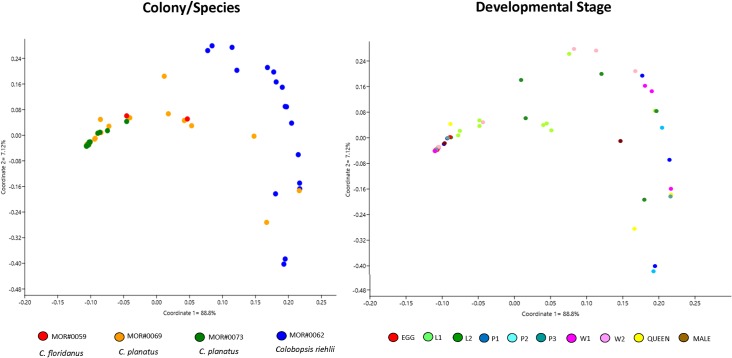
Fig 2. PCoA plots of bacterial communities associated with Camponotini samples (weighted UniFrac method).
A. Different colonies/species (axis 1 = 88.8% and axis 2 = 7.12%) and B. Developmental stage (axis 1 = 88.8% and axis 2 = 7.12%). Note that the "Colony/Species" category influences the bacterial community more than "Developmental stage".

