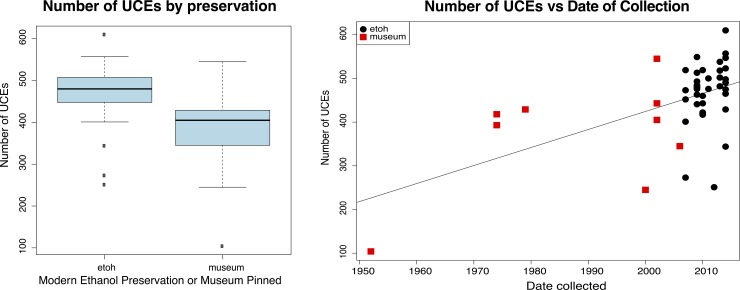
Fig 3. Left: Boxplot of number of UCEs by preservation type.
Average number of UCEs for modern ethanol preserved specimens was higher than for museum pinned specimens. Right: Plot of number of UCEs vs their date of collection. Plot shows general trend of fewer UCEs captured for the older the specimens, however the exact rate of decrease would require more specimens systematically sampled by precise preservation type.

