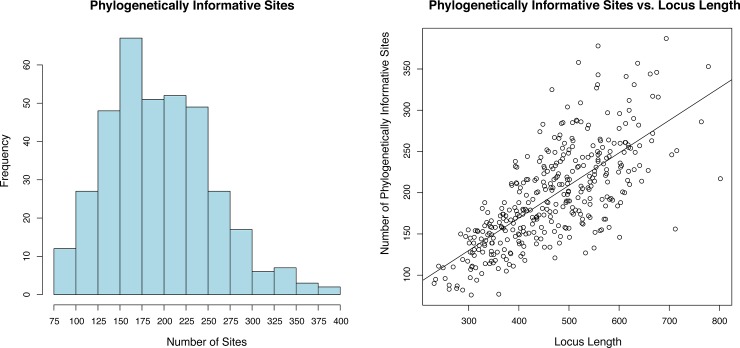
Fig 4. Left: Histogram of the number of potentially informative sites per locus from final data matrices, calculated with pis function it the R library ips.
Right shows linear regression between the number of phylogenetically informative sites and loci length. Loci of shorter length tend to have a narrower range of informative sites whereas longer loci tend to have a wider range, giving the distribution a clubbed appearance.

